MISSION BAMBOO USAGE STATE PROJECTS CALENDAR MARKET INFOSHEETS
SITEMAP CONTACT US GALLERY
SHOOTS | STRUCTURAL | COMPOSITES | MACHINERY | REHABILITATION  
SHOOTS | COMPOSITION | CUISINE | UNITS | TESTING
Back  Print Version  Email Page  Give Feedback

Composition/Testing

Testing of shoots by the Midland Fruit & Vegetable Products (I) Pvt. Ltd., New Delhi

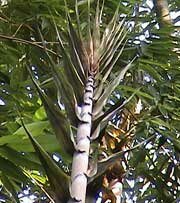
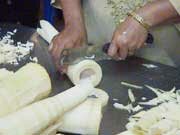
Different species were tested for their extractability, i.e. the edible portion portion was extracted after removing the peels and other spoilt portions. The net edible portion was divided by the total weight of the unpeeled shoot to calculate the extractability.

 S. No.

 Species

 Edible Portion

 1

 Dendrocalamus hamiltonii  (big)

 45.75%

 2

 Dendrocalamus hamiltonii (small)

 26.62%

 3

 Bambusa balcooa

 32.71%

 4

 Dendrocalamus strictus

 20.90%

 5

 Bambusa tulda

 19.14%

 6

 Bambusa pallida  (big)

 17.79%

 7

 Bambusa pallida(small)

 18.84%

 8

 Bambusa polymorpha

 15.96%

 9

 Melocanna bambusoides

 14.72%

Standard methods were employed to obtain the nutritional composition of the shoots. The methods are listed below:

  1. Moisture : as per AOAC
  2. Ether extract: as per AOAC
  3. Minerals (total ash) : as per AOAC
  4. Phosphorus: as per AOAC
  5. Calcium : as per AOAC
  6. Iron : as per AOAC
  7. Hydrocyanic acid : as per AOAC
  8. Protein : as per SP 18 Part – 1.8
  9. Niacin : by HPLC
  10. Carbohydrates : by difference

NUTRIENT COMPOSITION OF DIFFERENT VARIETIES OF BAMBOO SHOOTS

Test

B.
bal
cooa

B.
polymo
rpha

M. ba
mbus
oides

D.
stri
ctus

D.
hami
ltonii

D.
giga
nteus

B.
pall
ida

Moisture
% age

91.65

91.65

91.22 

85.98

92.37

91.19

92.29

Ether
Extract
%age

0.817

0.44

0.518 

0.82

0.314

0.502

0.34

Minerals
(as total
ash)
% age

0.99

0.91

 0.98

1.14

1.01

 0.89

1.12

Phosp
horus
mg/100g

30.99

15.06

14.28 

58.13

27.76 

12.57 

32.27

Calcium
mg/100g.

24.01

180.69

 47.58

139.5

44.16

26.93 

21.17

Iron
mg/100g

1.02

1.53

0.879 

 2.917

1.65

1.06 

1.11

Hydrocy
anic acid
%age

 0.071

0.032

0.056 

0.13

0.070

0.044 

0.106

Protein
% age

2.74

2.10

3.29  

1.98

2.60

2.59  

2.31

Niacin
mg/100g

 1.40

2.60

6.70

2.10

2.60

 6.40 

1.40

Carbohy
drates
%age

3.90

4.86

3.93

9.94

 4.00

4.78  

3.83


© 2009, TIFAC, India. All rights reserved.
Our new media partner: Inomy Media
Give Feedback Or Contact Us